Showing posts with label stryd. Show all posts

Wednesday, 4 November 2015

More Stryd Experiments

In my previous post I described my first impressions of the Stryd running power meter. I've now had a chance to do a few more interesting runs and so far the power readings are looking pretty good.

Lactate Threshold Session

The first run I did since my last post was a Lactate Threshold session. This was 6km long with about 1.5km warm-up and then the remainder at my lactate threshold pace of 3:58/km. This is the pace I ran my fastest half marathon at and gives me an average heart rate of somewhere in the high 160's.

This run was recorded using the Stryd Beta iOS App synced straight to the Stryd Power Center (all graphs below are extracted from Power Centre). I also ran with my Suunto Ambit3 paired with a different heart rate strap to compare data sets. Happily the data from Stryd Power Centre matches pretty closely to that recorded by the Ambit3

Power vs Elevation vs Heart Rate

This graph shows plots for the LT part of the run with power in orange, heart rate in purple and elevation in pink. It's quite obvious to see that I had big power spikes on each of the two small hills that made up the run (around 8 minutes and 16 minutes in). You can also see a power drop during the downhill section (10 minutes).

Certainly something to work on in the future is trying to smooth these spike by adjusting effort and pace in order to maintain a steady power level throughout the run. I believe that this is much more the objective when running with power as the primary metric.

As expected, my heart rate gradually raises over time as I start to tire and this is usually what I see when I'm trying to maintain a consistent pace for a period of time. What is interesting is that average power output seems to remain fairly steady even though heart rate is going up.

What's also very noticeable is the steep rise in heart rate corresponding to the power spikes on the hills and that although my heart rate decreases after each hill it never returns to the level that it was at before that hill. I would expect that by trying to smooth out the power spikes on those hills, I would also get a much lower heart rate increase and perhaps be able to achieve a lower average for the same pace across the whole run. Something to test out in a future session and a good long term goal to aim for.

Power vs Pace

The second graph plots for the LT part of the run with power in orange and pace in blue. Not sure what happened between 12 and 13 minutes into the run as my Ambit3 didn't record such a pace fluctuation, so I'm going to assume this is just a data anomaly with the iPhone GPS readings.

What you can see from this graph is that I maintained a consistent pace across the whole run, even though there were a few small hills along the way. This consistent pace is the cause of the power spikes and heart rate raises on the hills. Again, next run the aim will be to try to keep a consistent power and let the pace vary as necessary.

Average Power Output

If I exclude the power spikes, caused by inconsistent pacing on the hills, and focus just on the two flat sections where power was steady I'm achieving an average power output of 345 watts (4.6 watts/kg). This seems fairly consistent with my 250 watts (3.3 watts/kg) recovery pace output and gives me a fairly decent baseline power figure for future Lactate Threshold sessions and half marathon efforts.

Track Intervals Session

The second run that I did was a session on the track. The entire session is shown on the plot below with power in orange, heart rate in purple and pace in blue:

This was all recorded on my Ambit3 using a second HRM strap to capture the heart rate data (as dual power and heart rate from Stryd to Ambit3 doesn't currently work). The session was divided as follows:

  • Minutes 0 to 5: 800m easy warm-up
  • Minutes 7 to 13: drills (skips, high knees, heel flicks etc.)
  • Minutes 13 to 22: short sprints (about 30m at 80% effort)
  • Minutes 22 to 55: intervals – pyramid of 200-400-600-800-600-400-200m efforts with the same distance as the previous interval jogging recovery between each
  • Minutes 55 to 60: 800m easy cool down

Zooming in on just the intervals pyramid, we get the following graph:

Overall

The one thing you can clearly see is how well power tracks pace and reacts almost instantaneously. Given these were all fairly short bursts, heart rate is also following along quite well, but you can clearly see the lag at the end of each interval as it slowly returns to the recovery level. You can also see how my max heart rate increases each interval, making it a less than ideal measure of intensity compared to power.

Intervals

Power levels look pretty consistent as I would expect. The power for the first 200 is higher than any other interval (the last 200 was slow as I had a sore calf muscle at this point). The 400's have a higher power than the 600's and the 800. Both of the 600's and the 800 have a raising power towards the end as I pushed a bit harder.

Interestingly most of the intervals have a power dip at some point around the middle, probably indicating that I'm going off too fast and then slowing down too much in compensation. This isn't really noticeable on the pace graph, so either the stryd is giving me a valuable insight (which I suspect is actually the case) or it's not got it's power measurement quite right. Certainly something to play around with on my next track session.

The average power figures for each interval are:

200402 watts
400388 watts
600358 watts
800369 watts
600362 watts
400388 watts
200377 watts

It's good to see that each interval either side of the pyramid has roughly identical average power. Interesting also how the 800 interval has higher watts than the 600's. However, looking at the pace graphs, I started out the 800 a bit too fast, which probably accounts for this figure.

One other thing I learnt is that using this data I am able to work out an approximate 3 minute sustainable power of something around 370 watts (4.9 watts/kg).

Recoveries

Between each interval there was a recovery period of the same distance as the interval just completed. I'm running all of these pretty steady and consistently at a relaxed pace of about 5:40-5:50 per km. Both the pace and power seem quite steady.

What is interesting from these is that average power is around 250 watts, whereas a previous recovery run had me being able to maintain 250 watts off a much faster 5:10/km pace. My suspicion is that this clearly shows a drop in running form due to fatigue from a hard interval (although see the next section also for another idea). Clearly something to work on is focusing on the power during these recoveries and trying to keep it as low as possible by maintaining good running form even though fatigued.

Warm-up and Cool-down

One slightly strange observation from this session was during the warm-up and cool-down laps. Given that these were on the track and an average pace of about 5:30/km I would have expected much lower power readings than the 250 watts that I have seen during recovery runs at 5:10/km pace on undulating roads. Instead, my power was still averaging out at about 250 watts.

I have three hypothesis to play with here:

  • I run less efficiently while warming up and when tired at the end of a hard session (quite likely, but easily tested)
  • 250 watts is some magical minimum figure of the amount of power that I require to get me running and I can only go up from that point
  • My optimum efficiency pace is about 5:10/km and trying to run slower than that actually requires me to compromise my running performance (e.g. slower cadence, shorter strides) and that's less efficient and needs more power

This is definitely another area to play around with a bit more. I'm doing some slow runs with my children at the weekend, so will see how the results of these compare.

Multi-Terrain Run

The final run that I did was a multi-terrain recovery run. This wasn't anything particularly special as it was pretty slow and in horrible wet weather. Basically I just ran round a field five times while my boy was football training on the pitch in the middle! However what is interesting is the power map generated by Stryd Power Centre:

This map is coloured by power, with a scale from green being the areas of lowest power on the run and red being the areas of highest power, with orange being the middle between the two. Pace was a steady 5:30/km for the entire run and the terrain is pretty much flat the whole way round (3m elevation change round the whole 1km loop).

What is very evident from this picture is the change of power with the change of running surface. The bottom right section is mostly green and corresponds with a tarmac footpath and car park. The right hand side is the highest power and this corresponds to the transition from tarmac to longer grass. The entire top is in longer grass, except for the very small section directly above the football pitch that was well manicured. The left hand side was short grass but slightly wetter, while the bottom left was another area of well manicured grass.

This looks like conclusive proof that Stryd is correctly calculating differences in power requirement for running at an identical pace on different running surfaces.

Wednesday, 28 October 2015

Stryd Running Power Meter – Initial Thoughts

I backed the Stryd Running Power Meter in Kickstarter earlier this year as I thought that it looked like an interesting innovation. After a few months of waiting and some radical changes to the design, my Stryd device finally arrived yesterday. I've only taken it out on two runs so far, so this is very much an initial thoughts review. I'll follow up with more details as I get to grips with the device over the next few weeks.

The Hardware

The initial Kickstarter project was for a small clip-on device, but over the length of the project this evolved into a chest strap with built-in heart rate monitor (HRM) in addition to the power meter. Some people were a bit unhappy with this, but as I pretty much live in an HRM chest strap it doesn't really bother me that they decided on this form factor.

The actual device is somewhat larger than my current Suunto HRM, but it's very thin and light so I haven't really noticed any difference when wearing it. It looks to be a well engineered piece of kit and has the added bonus of a small flashing orange LED so that you can see that it is active, something I have struggled with on previous HRM devices.

Setup

The setup process is pretty easy. There's an iOS app that pairs the device and allows you to enter your weight (as this is essential for the power calculation). Then it's just a matter of pairing the Stryd with your GPS watch as a Power POD, and configuring an exercise mode to support power. Then it's time to go running...

Future versions of the App will apparently allow firmware upgrades and tracking of power data, but at the moment all it does is set your weight onto the Stryd. You have to have a GPS watch or use a third party phone App to track your runs and collect power data.

Data Collection and Usefulness

I've only done two runs with the Stryd so far but my initial findings are that it's power reading is a pretty good metric of what's going on with my run. There certainly seems to be a very close correlation between effort and power and their relationship to pace. Heart rate also appears to have the correct relationship to power and effort with all the usual lag in change of heart rate following change in effort.

The first thing that you notice is that when maintaining a consistent pace that power goes up when running uphill, goes down when running downhill and stabilises somewhere in middle when running on the flat. All as you would expect. I also found that I could maintain a fairly consistent power by slowing my pace on the uphill and running harder on the down.

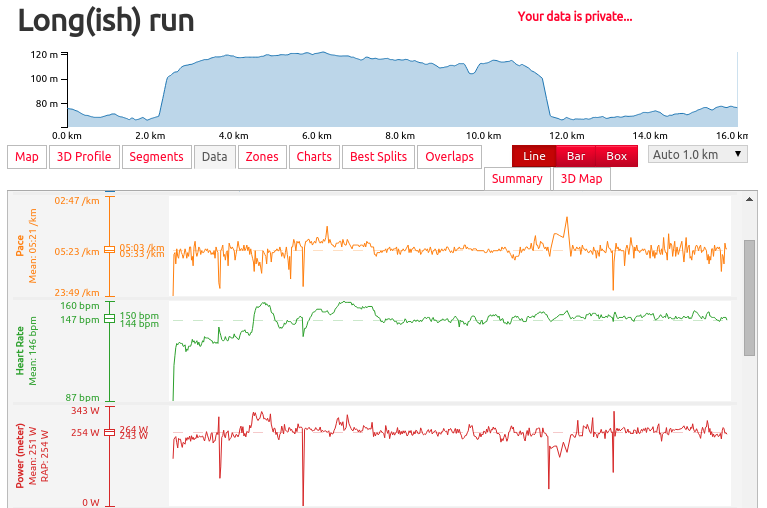
For a fairly steady run at about 5:23/km (a pace I can sustain at aerobic effort for a long duration run) power was a fairly steady 252 watts. This seems about right and corresponds reasonably well to the same normalised power output of similar effort on the bike.

I also did a short test to see how power relates to running form. Over a six minute period on a flat gravel path I did three minutes trying to hold my best running form (high cadence, mid-foot strike, short stride length, pelvis up and forward, head high) and then three minutes trying to do the opposite (over-striding, heel strike, bum sticking out, slouched shoulders). The graphs covering this period are shown below:

You can clearly see for the first part that the power is fairly consistent in a band of about 252-270 watts, averaging out at 262 watts on a pace of 4:38/km. Heart rate gradually climbs as I'm going faster than I was previously and then levels out.

The second part shows a very different picture. Power is jumping around all over the place in a band ranging from 237-318 watts, with an average of 269 watts. Average pace is a bit slower at 4:46/km (couldn't run any quicker with such a broken running style!). Heart rate continues to climb above it's previous level.

So, evidence is that power looks to be a good measure of running form and efficiency. For a given pace on a consistent terrain it looks as if a drop in running form is directly related to an increase in power and visa-versa. This is definitely something I will be experimenting with further to determine if, for a given target pace, I can achieve it with a lower power value.

Also it's probably a good way to measure the rate at which running form decays over a long run by maintaining a consistent pace and seeing how power required to hold this pace goes up over time. Another option would be to pick a consistent power and see how pace required to hold that power slows over time.

The other thing I really want to play around with is whether the running surface has a significant impact on power and whether different technique adaptations for the surface can impact that power. The only firm conclusion I have from my runs so far are that grass requires about 10-15 watts more power to run at the same pace compared to road or gravel path. Any other comparison from my runs don't have value as the only time I spent on road was at the end of the long run when fatigue had already started to kick in.

Device Weaknesses

While I'm pretty pleased with the Stryd, it is pretty much a running only device. This makes is less useful during the triathlon season as far as I can see.

First off, it's not really waterproof enough to wear while swimming (the instructions say that you can rinse it under a tap to clean, but that's about it). Also, my Suunto HRM has on-board memory to capture heart rate while swimming that it then syncs to my Ambit3 when out of the water and a connection is re-established. The Stryd doesn't have this feature.

Secondly, the Stryd pairs to the Ambit3 as a 'Power POD', which means that wearing it on the bike could give some strange results (not actually tested this yet). For example, riding a bike without a power meter but with Power POD support enabled would likely cause the Ambit3 to think the Stryd was actually a bike power meter and record some very low power values. Not sure what would happen if I had both a bike power meter and the Stryd available at the same time - which one would be selected?

So, in a triathlon scenario I'd probably be left with two options:

  • swap straps in T2 from my Suunto HRM to the Stryd ready for the run – doesn't make for an efficient T2 and probably not practical for anything but long course events
  • wear both my Suunto HRM and the Stryd strap for the swim and bike and then just clip the Stryd to the strap in T2 – slightly faster, but means wearing 2 straps for the whole event, which isn't very comfortable

I personally can't see the current Stryd iteration getting much use during triathlon except on pure run workouts.

Ecosystem Issues

While the Stryd is a pretty neat, clever and polished device, it's something very new to have power data in running mode and to have a single device that captures both power and heart rate data. At the moment this seems to have broken quite a lot of the ecosystem that I use. Hopefully this will gradually resolve itself over the next few months as everyone catches up with Stryd's innovation.

As of today, here's some of the ecosystem issues I've discovered:

Suunto Abmit3

The Ambit3 probably has the best support for the Stryd as it already allows capturing power data in running modes (on Garmin devices you have to currently run using a cycling mode to support the Stryd!).

That said, there are a couple of issues that the Ambit3 still has:

  • It currently can't stream both power and heart rate data from the Stryd at the same time. If you pair the Stryd as a Power POD then it's useless as an HRM. Suunto are apparently working on new watch firmware to overcome this problem. In the meantime I'm running with two chest straps so that I can get power and heart rate data - and it's a bit uncomfortable!
  • For some reason I'm not getting any cadence data when using the Stryd. It looks like pairing it as a Power POD disables the cadence sensor built in to the Ambit3 and assumes cadence will come from the Stryd, but this data doesn't seem to be available. Hopefully this is just a bug that will be resolved by the next firmware updates as I tend to do quite a lot of work on maintaining a high cadence.

Suunto Movescount

Movescount seems to handle runs with power quite happily. The data is captured nicely and you can graph and explore the power values.

I have however found an error in Movescount where the FIT file format export seems to be missing occasional data points. When you drop this into Stryd Power Centre it results in a very jagged graph. Training Peaks uses the same FIT files and it also has the same missing data points problem. The data points aren't missing in GPX and TCX files so I've raised this as a bug with Suunto.

Stryd Power Centre

The Stryd Power Centre site seems to work pretty well and draws some nice graphs. Will be interesting to see how this develops over time. It should grow to be fully featured as it's an integral part of the Stryd offering.

Unfortunately it deals with the error in the Suunto FIT files by rendering zero values for power and heart rate if a data point is missing, which results in a very difficult to analyse, jagged graph. Training Peaks takes a better approach by just not rendering a data point in the graph for any data points that are missing.

Strava

Strava seems to quite happily receive runs from Movescount that contain power and hold on to that data. However it currently doesn't provide any way to view the power information for a run. It does export the power data to sites that pull data from Strava (e.g. VeloVeiwer) which is good.

Training Peaks

Training Peaks takes its data from Movescount in FIT file format so exhibits the missing data points problem. It currently doesn't display any power summary information for run activities, but if you expand the activity view you can see power on the graph and get lots of other interesting power metrics.

VeloViewer

VeloViewer pulls activity data from Strava and allows you to do lots of extra analysis on your performance. It successfully retrieves all of the power data for a run and graphs it properly. Also, because it's GPX based it doesn't suffer from the missing data point problem. This will probably become my default site for analysing my Stryd recorded runs until the other sites resolve their various bugs and lack of features.

Summary

From my initial runs, the Stryd looks very promising. Running power certainly appears to be a useful metric for evaluating form and efficiency. For any given pace and terrain it looks to be a much more stable metric than heart rate and a good measure of effort expended. Still lots of experiments to do though before I consider switching power to be my primary run training metric. I will be very interested to see the output from my next track intervals session on Monday.

At the moment, I'd say that the ecosystem is the main thing that is letting the Stryd down. If you are happy to be an early adopter and work round things that don't quite function as you would want then Stryd is certainly worth some experimentation. If you are after something that is polished and just works with all your devices and running data sites then I'd suggest waiting a few more months until the ecosystem catches up with this new and innovative approach to running metrics.